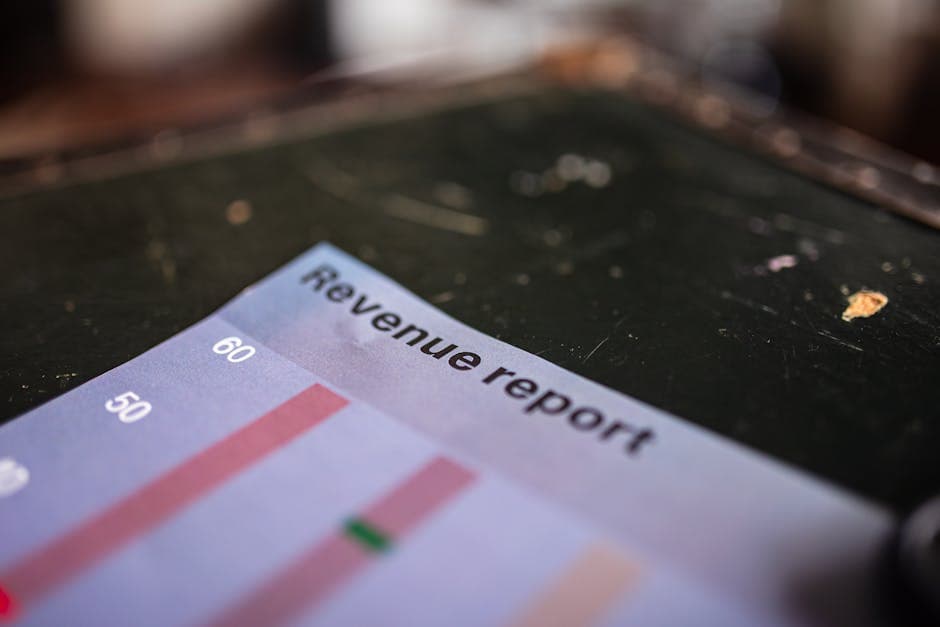
Event Sponsor ROI: Why Your Portfolio Data Is Undermining Renewals
Sponsors aren't questioning your smaller events' value — they're rejecting the inconsistent data you use to prove it
Learn why associations lose sponsor renewals on regional events due to structural measurement gaps, not performance. See how consistent data across your full event portfolio rebuilds renewal confidence — and why anecdotal recaps undermine it.
TL;DR
Sponsor renewals fail because of inconsistent data, not insufficient data - When your flagship gets full analytics and your regionals get anecdotes, sponsors can't compare value. So they cut the events that look weakest on paper.
Pipeline contribution beats lead counts - Smaller events often deliver higher lead-to-opportunity conversion rates, but you'll never prove it if you're measuring leads differently (or not at all) at each property.
Standardize measurement inputs across every event - Same lead capture methodology, same qualifying criteria, same attribution windows. Consistent definitions make portfolio-level ROI visible and trustworthy.
Sell a portfolio, not individual events - When sponsors can see how each event contributes differently to the same pipeline outcome, the renewal conversation shifts from justification to expansion.
Your Sponsors Aren't Comparing You to Competitors. They're Comparing Your Events to Each Other.
Here's the uncomfortable pattern we keep seeing: an association runs a flagship conference and three regional events. The flagship gets a polished post-event report with lead counts, booth traffic, and pipeline numbers. The regionals get a thank-you email and a photo gallery. Then renewal season arrives, and the sponsor asks a perfectly reasonable question: "Why am I spending across all four?"
The sales director scrambles. The answer is intuition, relationship, and a vague promise that the smaller events "drive awareness." The sponsor doesn't renew the regionals. Event sponsor ROI was never the issue. The issue was that nobody could prove it consistently. In fact, 40% of non-investing corporate sponsors cite insubstantial previous results as their reason — making consistent ROI proof a direct driver of sponsorship renewal.
The Measurement Trap Everyone Falls Into
The sponsorship industry has spent years building better dashboards. Real-time analytics. RFID tracking. Lead capture tools that scan badges and sync to CRMs. And to be fair, these tools work. At the events where they get deployed.
The problem is that deployment follows prestige. Flagship events get the full measurement stack because they carry the biggest price tags and the most organizational attention. Smaller events — the ones that may deliver better lead quality per dollar — get a clipboard and a spreadsheet. It's a costly gap: according to Wave Connect, citing Exhibit Surveys, 80% of trade show leads are never followed up on at all.
This creates a structural asymmetry. 48% of sponsors say sales leads are a key metric for measuring sponsorship ROI. But when half your portfolio captures leads with rigor and the other half relies on anecdotes, you're not measuring a portfolio. You're measuring fragments.
The conventional wisdom says the fix is more sophisticated measurement at each event. Better tech, better dashboards, better reports. We think that misses the point entirely.
The Real Problem Is Consistency, Not Sophistication
Here's what we actually believe: sponsor renewals don't die from a lack of data. They die from data that can't be compared.
A sponsor who sees 200 leads from your annual conference and 40 leads from a regional workshop isn't looking at a 5:1 ratio. They're looking at two completely different measurement systems producing numbers that share a label but not a methodology. "Leads" at the flagship might mean badge scans with qualifying questions. "Leads" at the regional might mean business cards dropped in a fishbowl.
When you can't stack results across events using the same definitions, every smaller event looks like it underperformed. Not because it did, but because the comparison is structurally unfair.
What Pipeline Contribution Reveals That Lead Counts Hide
Consider a pattern we've observed across association portfolios. A flagship conference generates 300 leads for a sponsor. Impressive on a slide deck. But when those leads flow into the sponsor's CRM, maybe 15 convert to qualified opportunities. That's a 5% lead-to-opportunity conversion rate.
Meanwhile, a 200-person regional event generates 35 leads for the same sponsor. Underwhelming on a slide deck. But 12 of those leads convert. That's a 34% conversion rate. The regional event, dollar for dollar, is contributing more pipeline value than the flagship. But the sponsor will never know this if the association reports raw lead counts from one event and "great engagement" from the other.
This is exactly what SaaStock's framework emphasizes: measure lead quality by conversion rate, not just lead count. The metric that matters isn't volume. It's pipeline contribution — the real business impact that flows through a sponsor's funnel after the event.
But pipeline contribution only becomes visible when you track it the same way everywhere. Same lead capture methodology. Same qualifying criteria. Same post-event attribution window. When you standardize the inputs, the outputs tell a story that sponsors actually trust.
Showcare's 2024 analysis reinforces this point: sponsors now evaluate success across ROI, ROO (return on objectives), and ROE (return on engagement) at the same time. Financial return alone doesn't tell the full story. But none of these can be assessed at the portfolio level if every event measures them differently — or skips them entirely.
This is where platforms like Clarity become relevant. By building a consistent data layer across all events, associations can align sponsor KPIs — so a lead from a 150-person workshop counts the same way as one from a 5,000-person conference. The sophistication isn't in the dashboard. It's in the consistency underneath it.
And the stakes are real. Global sponsorship spending is projected to reach $189.5 billion by 2030, and 44% of corporate marketers increased their sponsorship budgets over the prior year. Sponsors aren't pulling back from events. They're pulling back from events that can't prove comparative value. That's a key distinction for any sales leader managing multiple events.
What Changes If You Stop Treating Each Event as an Island
If this is right, it reshapes how association sales leaders approach renewals. You stop selling individual events and start selling a portfolio with normalized performance data. You stop dreading the "why should we sponsor the regional?" conversation because you have conversion metrics that make the case without anecdotes.
You also stop losing renewals to a problem that feels personal but is really structural. When a sponsor says "we didn't see enough value," they often mean "we couldn't compare the value you showed us." Those are very different problems. Only one needs better data. The other just needs more dinners. If your activation strategy is underperforming, the first question shouldn't be whether you need flashier activations. It should be whether you're even capturing the right data to know.
For sales leaders building sponsorship packages designed to generate qualified leads, this means baking measurement consistency into the package design itself, not bolting it on after the fact.
Think Portfolios, Not Properties
The mental model shift is this: stop thinking of your events as separate products with separate scorecards. Start thinking of them as a single investment portfolio where each property contributes differently to the same sponsor outcome.
Your flagship is the awareness engine. Your regionals are the conversion engines. Your virtual events are the nurture layer. But you can only tell that story if every property feeds the same measurement system with the same definitions. The question isn't "how do we prove ROI at this event?" It's "how do we prove sponsor value across all of them in a language sponsors can compare?"
Sponsorship isn't a measurement sophistication problem. It's a fulfillment consistency problem. And the associations that solve it will stop competing on relationship and start competing on proof.
The Sponsors Who Stay Are the Ones Who Can See the Whole Picture
Sponsors don't leave because one event disappointed them. They leave because they can't see how the pieces fit together. Give them a portfolio view with consistent, comparable pipeline contribution data, and the renewal conversation changes from "convince me" to "where do we go next."
That's not a sales tactic. That's a structural advantage. And right now, almost nobody in the association world has built it. In fact, an ANA/MASB survey found that only 37% of organizations have a standardized process for measuring sponsorship ROI — meaning nearly two-thirds operate without one.
Frequently Asked Questions
What is event sponsor ROI and why is it important?
Event sponsor ROI measures the real return a sponsor gets from an event — including pipeline growth, qualified leads, and revenue. It matters because sponsors use ROI data to decide where to spend. Associations that can't show it consistently risk losing renewals.
How do I compare sponsorship performance across events of different sizes?
The key is normalizing your metrics. Use the same lead capture method, qualifying criteria, and attribution windows at every event. That way, a lead from a 150-person workshop is defined the same as one from a 5,000-person conference. Then you can compare conversion rates and pipeline value — not just raw volume.
What are the key metrics to track for sponsorship ROI across a portfolio?
Focus on lead-to-opportunity conversion rate, cost per qualified lead, and event-attributable pipeline revenue. Tracked consistently across all events, these metrics give sponsors a clear, comparable view of value that raw attendance or lead counts can't match.
Sources
https://doublethedonation.com/corporate-sponsorship-statistics/
https://saastock.com/blog/how-to-measure-and-increase-event-sponsorship-roi
https://www.showcare.com/how-sponsors-measure-success-today/
https://www.claritymediapartners.com/blog/how-to-prove-sponsor-value-with-real-time-data-insights
https://www.marketingprofs.com/charts/2018/39525/measuring-sponsorship-roi-marketers-benefit-metrics